
Fig. 11.
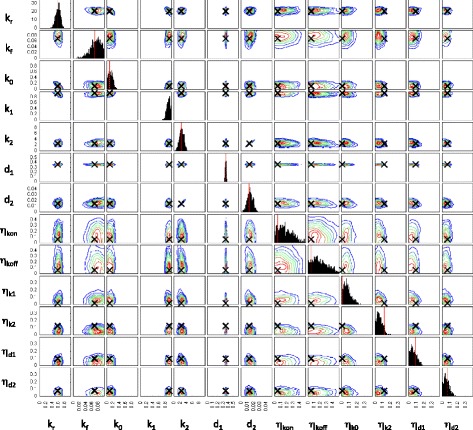
Posterior distribution of model parameters for a test case where synthetic data were generated by simulating from a model with known parameters. Contour plots indicating the density of points with the corresponding parameter values for each particle in the final population. The posterior distribution consists of 1000 particles