
Fig. 5.
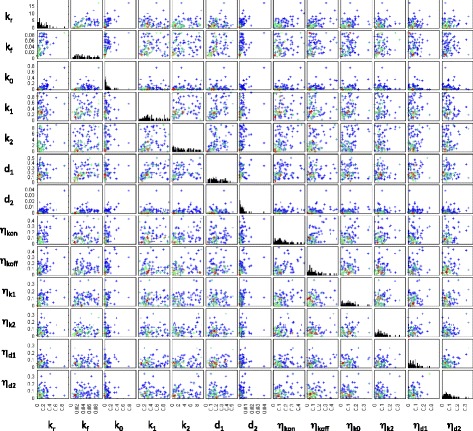
Relationships between the heaviest particles. Scatter plots of the particles with the highest weight in the final ABC-SMC population, shown for all pairs of parameters. Each point corresponds to one particle from the inferred posterior of one gene. Warmer hues are used to indicate a higher density of data points