
Fig. 6.
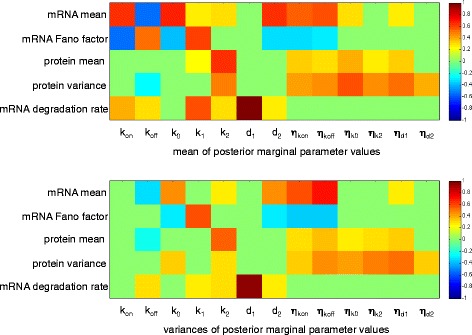
Heat maps of correlation coefficients between parameters and summary statistics. Heat maps are of the correlation coefficients calculated between experimentally obtained summary statistics and the mean (top) or the variance (bottom) of the marginal posterior for each model parameter. Correlation coefficients for which the associated p-values are greater than 0.05, after correcting for multiple testing using the Benjamini-Hochberg method [43], are treated as zero for plotting purposes