
Fig. 9.
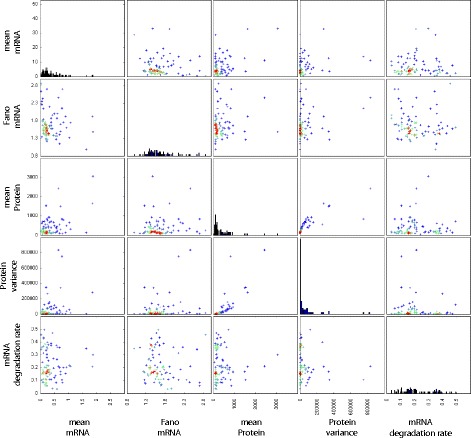
Experimentally measured summary statistics. Each point on the scatter plots is an estimate of the corresponding summary statistic or mRNA degradation rate from experimental measurements. These data are taken from [7]. The mRNA degradation rates were taken to be the inverse of the mRNA lifetimes