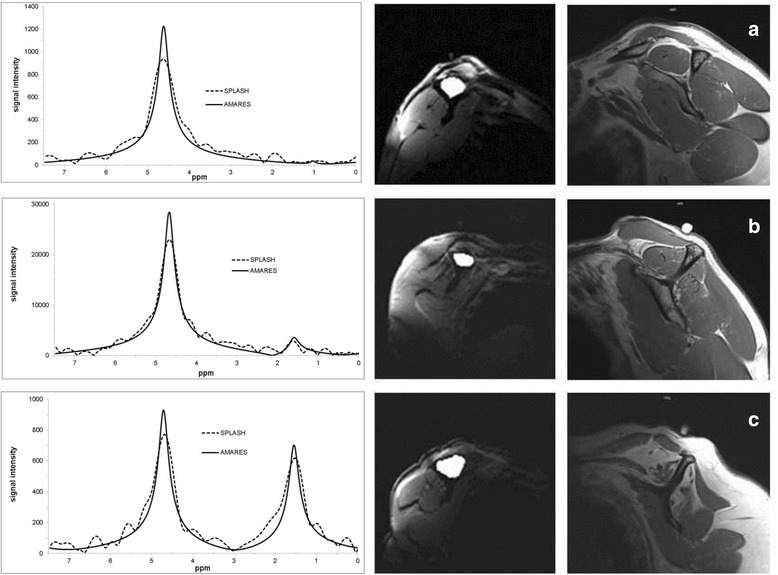
Fig. 1.

Spectroscopic analysis and quantification of the fat/water ratio in the supraspinatus muscle. The middle column shows the manual delineated borders of the supraspinous fossa in which the spectroscopic analyses were performed. The right collum shwos the accordingly oblique-sagittal t1-weighted MRI images. Calculated values for these examples of the fat /water ratio were a 1.29 %, b 12.67 % and c 77.41 %
