
Fig. 6.
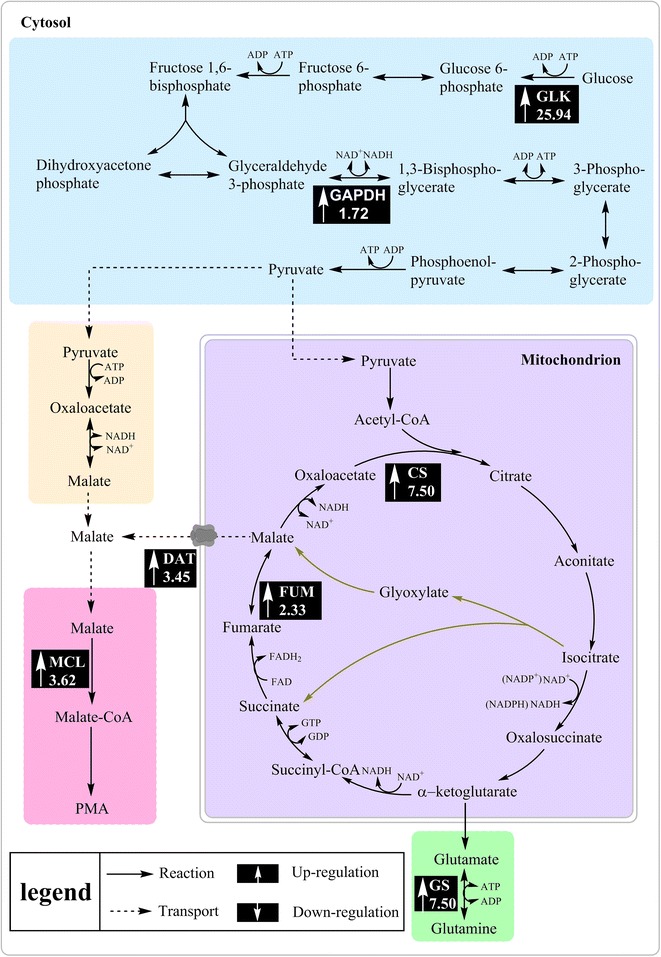
PMA biosynthesis metabolic network and the transcriptional changes of the genes encoding the enzymes catalyzing those steps. Up arrows represent the upregulated genes under nitrogen limitation (2 g/L of NH4NO3)
Official websites use .gov
A
.gov website belongs to an official
government organization in the United States.
Secure .gov websites use HTTPS
A lock (
) or https:// means you've safely
connected to the .gov website. Share sensitive
information only on official, secure websites.
PMA biosynthesis metabolic network and the transcriptional changes of the genes encoding the enzymes catalyzing those steps. Up arrows represent the upregulated genes under nitrogen limitation (2 g/L of NH4NO3)