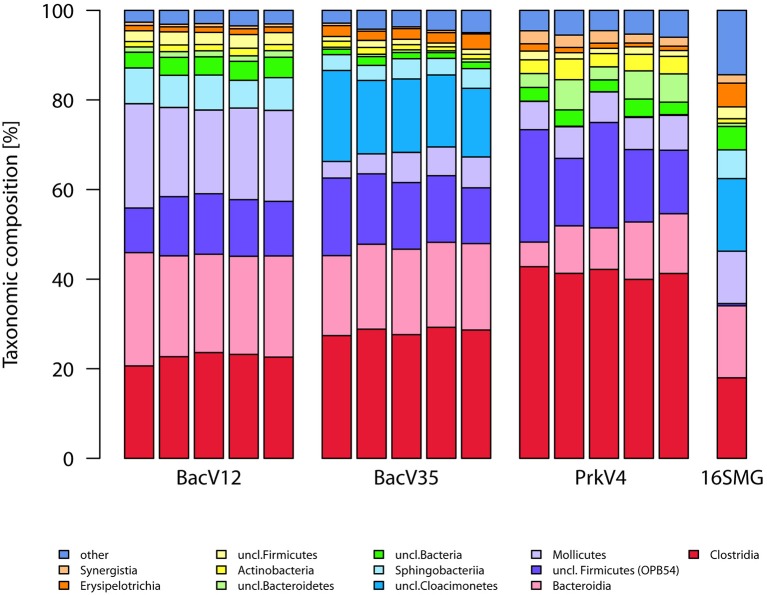
Figure 4.
Sequence compositions of the communities observed by the different bacterial and prokaryotic primer pairs on the class level. Shown are the five replicates of each primer pair as well as the 16S rRNA gene sequences extracted from the metagenome data pair (16S-MG). Annotation was done using the SILVA v123 database. Taxa with abundance below 1% were grouped as “other”.

