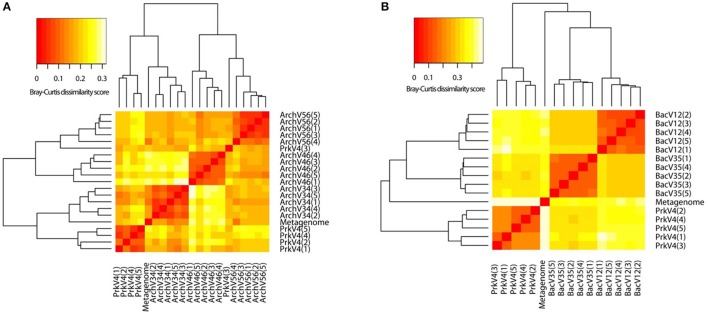
Figure 6.
Heat map derived from dissimilarity matrix of Bray-Curtis distances between archaeal (A) and bacterial (B) community compositions as observed by the primer pairs and the extracted metagenomic 16S rRNA gene sequences. Similarity between samples is indicated as a color gradient from higher similarity (red) to lower similarity in (white).

