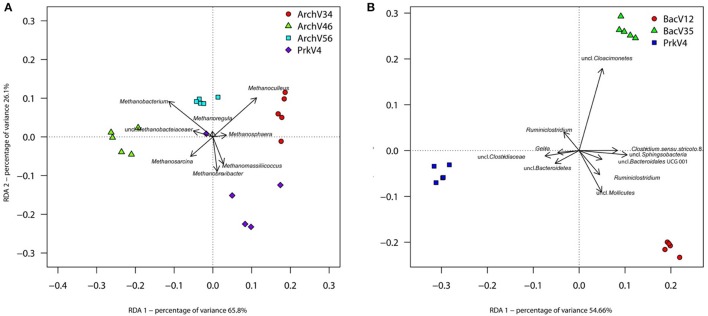
Figure 7.
RDA based on Hellinger-transformed taxon count data after Bray-Curtis dissimilarity calculation. Clear separation of the different primer pairs can be observed between the different archaeal (A) and bacterial (B) communities observed in the sample. The eight (Archaea) and 10 (Bacteria) taxa contributing most of the variance of the dataset are shown as vectors.

