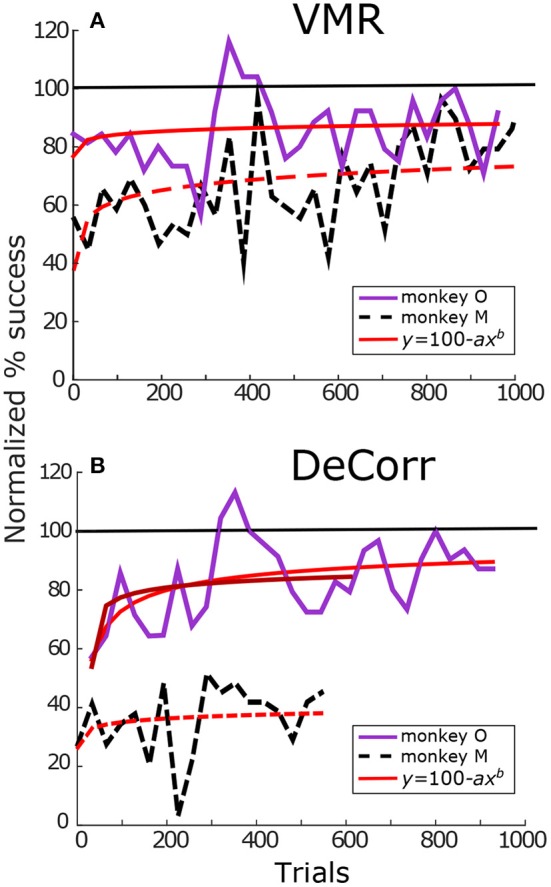
Figure 3.

Tasks performance. (A) VMR success for monkey O (solid purple) and monkey M (dashed black). Trials span across different days. Percentage success was normalized with maximum performance in baseline trials. The success rate was calculated per block (32 trials/block). Red trace shows fit for Wright's learning curve (y = 100−axb). with coefficients aO = 22.11, bO = −0.08 and aM = 58.1, bM = −0.10. (B) DeCorr performance for monkey O and monkey M in solid purple and dashed black lines, respectively. Trials span across different days with the same perturbed cPDs. Coefficients aO, 1 = 47.43, bO, 1 = −0.19, aO, 2 = 46.09, bO, 2 = −0.17, and aM = 74.91, bM = −0.03. The first fit of monkey O used the complete trial set, while the second one used partial trial set similar in length to that of monkey M. Format is the same as top panels. (monkey M had less data in DeCorr task, trials span for ~500 trials).
