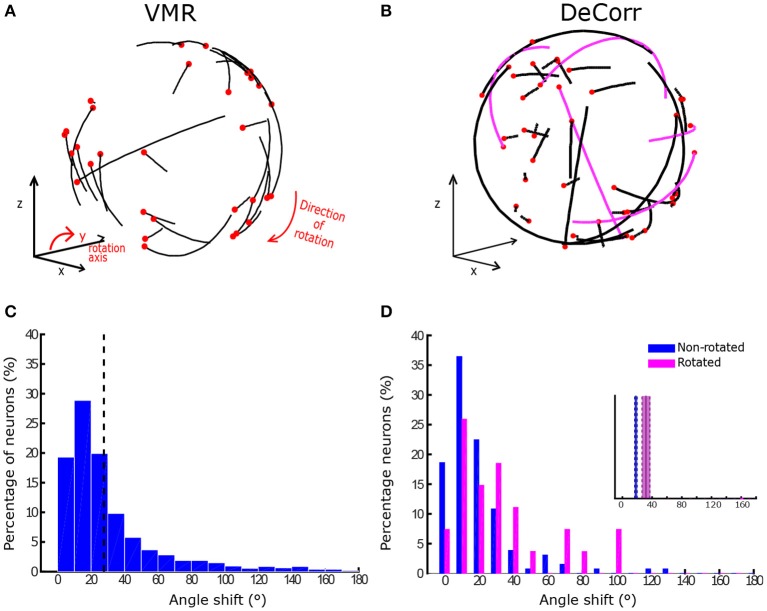
Figure 5.
Preferred direction changes in VMR and DeCorr task. (A) aPDs shifts during VMR task (CW direction): aPDs during baseline (black end) and after perturbation (red dot) are displayed for each neuron used for brain control. (B) aPDs changes during DeCorr task (5 rotated pairs): aPDs during baseline (black end) and after perturbation (red dot) are displayed for each neuron used in brain control, magenta trajectories highlight the rotated neurons. (C) Shift in neurons aPDs, pooled data are displayed for all VMR sessions for monkey O. Dashed gray line illustrates average shift. (D) Shift in neurons aPDs, pooled data for all DeCorr trials for monkey O. Blue bars show data for non-rotated neurons, and magenta bars display data for rotated neurons.

