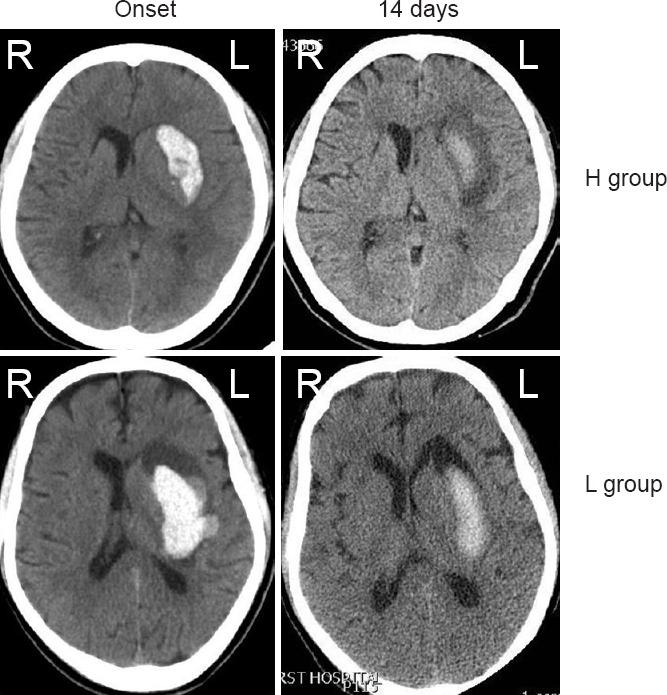
Figure 1.

Typical cranial computed tomography images of intracerebral hemorrhage patients showing the hemorrhage absorption process.
On the onset day, there was no significant difference in the hematoma volume between groups L and H. However, on day 14, hematoma volume was larger in the L group compared with that in the H group. L group: Low-level group, below the average level of soluble CD163; H group: high-level group, above the average level of soluble CD163. L: Left; R: right.
