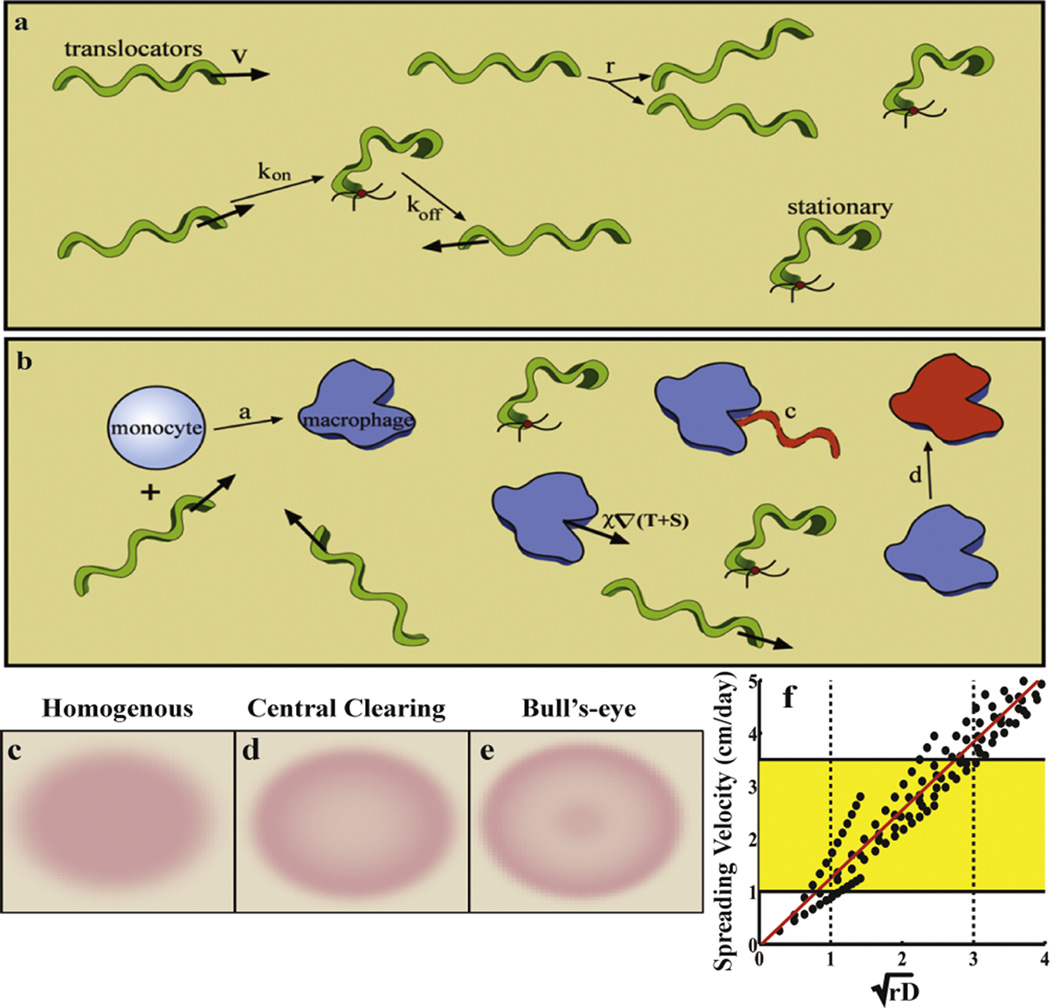
Figure 4. The role of biophysics in early Lyme disease.
(a–b) Schematic of the model. The pathogen-specific processes are shown in (a). Translocating bacteria move with velocity v, but can bind to the dermis with rate kon, thereby becoming stationary. The stationary bacteria unbind with rate koff. The bacteria replicate at rate r. (b) The innate immune response includes activation due to the presence of the bacteria (with rate a), clearing of the bacteria by macrophages with a rate constant c, and the macrophages are then cleared or die at a rate d. (c–e) This model recreates all three rash morphologies: homogeneous (or solid) rashes, central clearing rashes, and the hallmark bull’s-eye (or central erythema). (f) The model also predicts that the spreading rate is proportional to the square-root of the replication rate and the bacterial diffusion coefficient. The dotted lines show the expected values of these parameters and the yellow box highlights the clinically observed values for the spreading rate of the rash.

