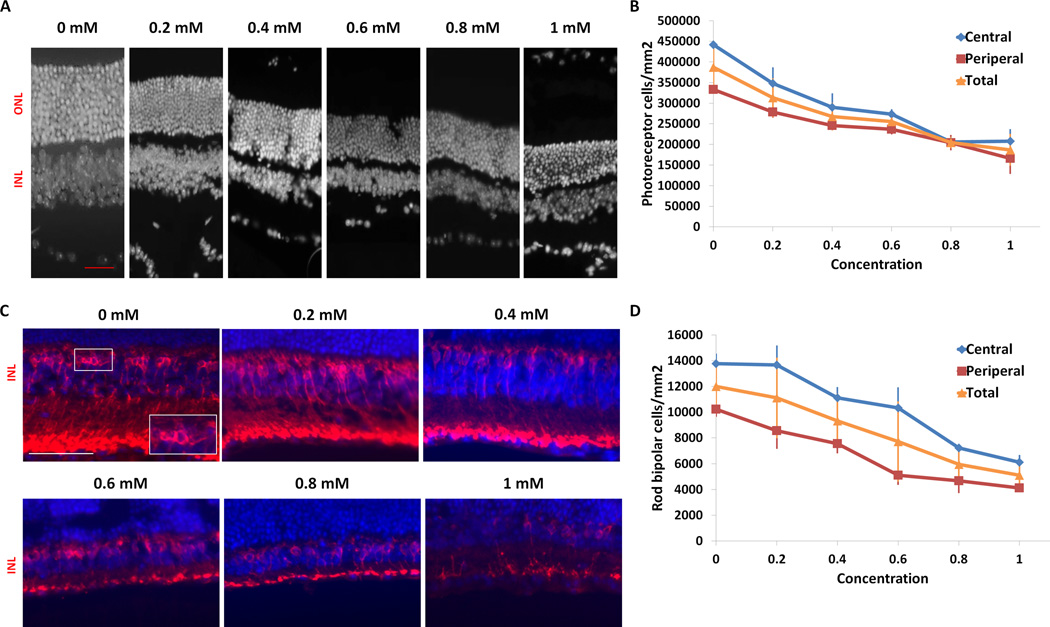
FIGURE 2. Analysis of photoreceptor loss following injection of paraquat.
(A) Representative images of the nuclear layers at 3 weeks following paraquat injection. Retina sections were stained with DAPI to visualize the nuclei. There is progressive thinning of the outer nuclear layer with increasing PQ concentration. (B) Quantification of photoreceptor cells in the outer nuclear layer across the retina shows mild, but significant, photoreceptor loss in eyes injected with the lowest dose of PQ (p<0.05, n=3) compared with eyes injected with PBS at the 3 week time point (n=3). Photoreceptor loss progressively increased with concentration, with up to 52% degeneration at the highest concentration (p<0.05, n=3). A similar pattern and rate of degeneration was observed in both the central and peripheral regions of the retina. (C) Representative images of rod bipolar cells in the inner nuclear layer of the retina 3 weeks after PQ injection. Retina sections were stained for the rod bipolar cell marker PKC and counter stained with DAPI for visualization of cell nuclei. Inset in 0 mM (lower right corner) is a magnified image of the boxed region. (D) Quantification of rod bipolar cells in the inner nuclear layer of the retina shows progressive loss of bipolar cells with increasing concentration. There was up to 58% loss at the highest concentration of PQ (1 mM) compared with eyes injected with PBS (0 mM) three weeks after injections (p<0.05, n=3). (Scale bar = 50 µm ((A) red, (C) white); ONL, outer nuclear layer; INL, inner nuclear layer). Means ± SD are shown.

