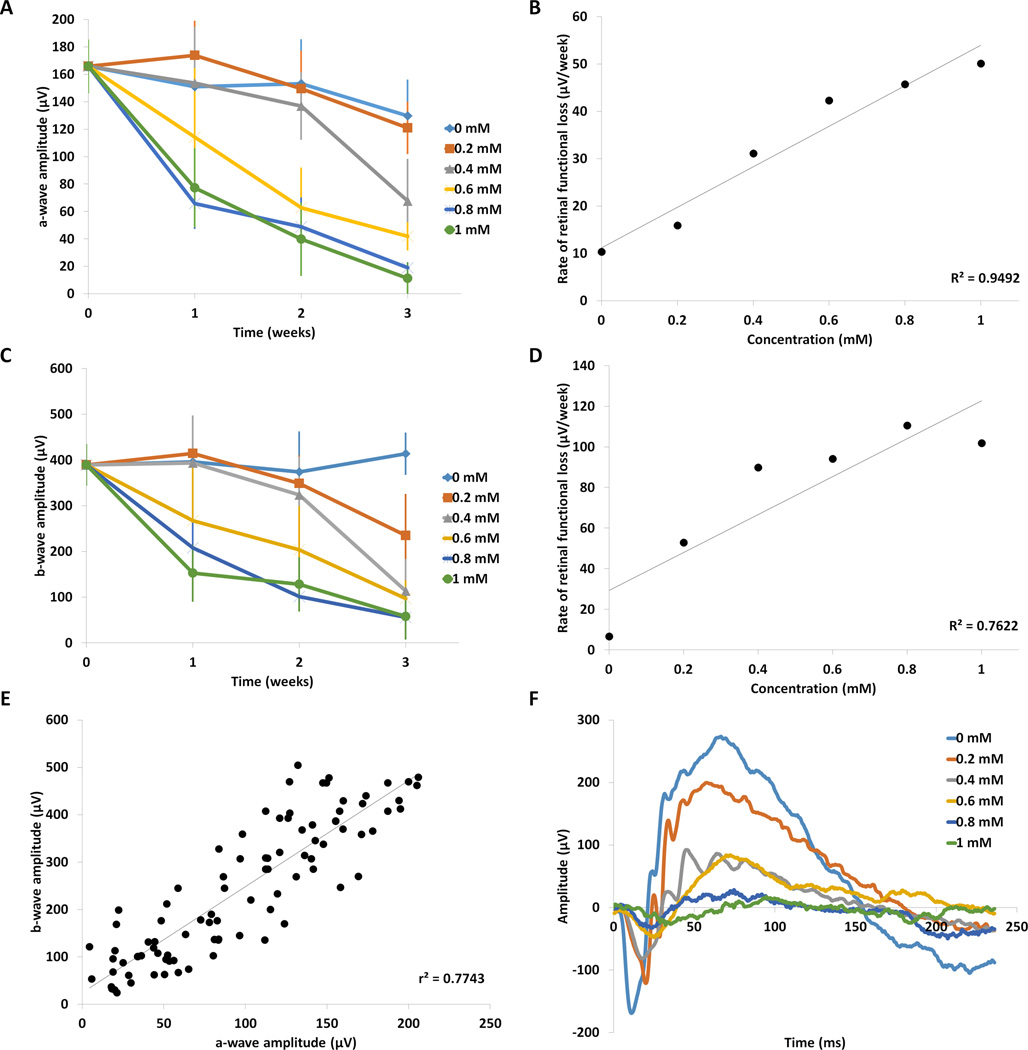
FIGURE 3. Analysis of retinal function following injection of paraquat.
(A) The average amplitudes of the scotopic ERG a-wave at each PQ concentration were plotted against time. The a-wave amplitude from mice injected with PBS (0 mM PQ) showed minimal change across the three-week time course (n=5), but decreased by time and dosage in mice injected with PQ. Means ± SD are shown. Means and standard deviations are listed in Supplemental Table 1 and significance is displayed in Supplemental Table 3 (a-wave) and Supplemental Table 4 (b-wave). There was no significant change in a-wave amplitude at low concentration of 0.2 mM PQ (n=5), but reductions of a-wave amplitudes at 3 weeks post injection were significant starting at 0.4 mM (p<0.05, n=5), compared with 0 mM PQ. (B) The rate of ERG a-wave decline was plotted against concentration and showed a linear trend (r2= 0.94). (C) The average b-wave amplitudes at each concentration were plotted against time and showed that PQ induced a time- and dose- dependent decrease. (D) The rate of degeneration of the b-wave amplitude increased in a linear manner with respect to concentration (r2= 0.76). (E) Scatterplot of matched a-wave and b-wave amplitudes from individual animals at all time points and doses. Regression analysis between a-waves and b-waves showed high linear correlation (r2=0.77, n=90). (F) Representative ERG waveforms (average curve from 10 flashes with an interstimulus time of 5 seconds) generated by animals three weeks after PQ injection at different concentrations are shown. The amplitudes of the peaks of the waveform become progressively smaller with increasing concentration, indicating decline in retinal function. Furthermore, the implicit times of the a-wave become greater with concentration, indicating declining retinal function with increasing PQ dose.

