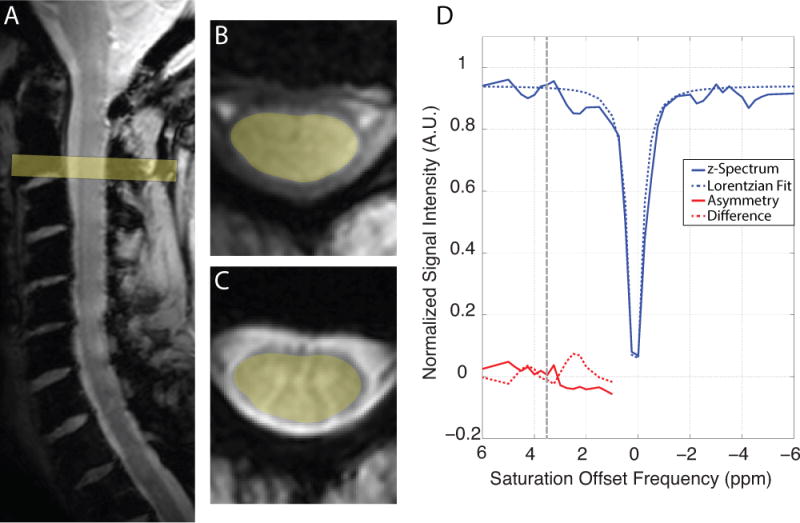
Figure 3.

Representative CEST data from a healthy subject scanned at 7 T. A) T2-weighted sagittal slice through the cervical spinal cord, B) T1-weighted axial slice and C) T2*-weighted axial slice through the center of the field of view at the level of C3. D) The z-spectrum (blue, solid) and Lorentzian fit (blue, dashed) from a region of interest encompassing the entire spinal cord are shown as a function of saturation offset frequency. Additionally, the calculated CESTasym (red, solid) and Lorentzian difference (red, dashed) are shown for comparison with 3.5 ppm denoted by the black dashed line.
