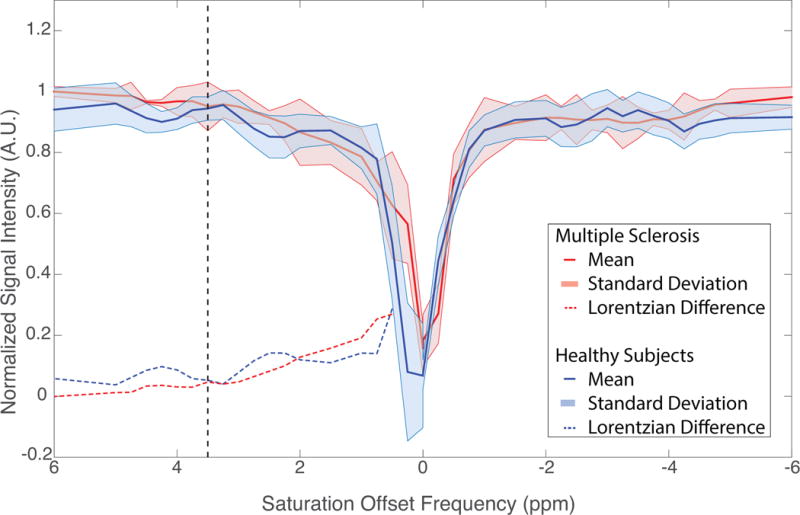
Figure 4.

Comprehensive results of CEST MRI in the spinal cord. Group mean (± standard deviation) z-spectra are shown for healthy subjects (blue, solid) and MS patients (red, solid). The calculated Lorentzian difference for these group mean z-spectra are plotted as dashed lines for the healthy subjects (blue) and MS patients (red). Healthy subjects show marked deviations from the Lorentzian fit at saturation offsets of +2 – +3 ppm and +3.5 – +4.5 ppm.
