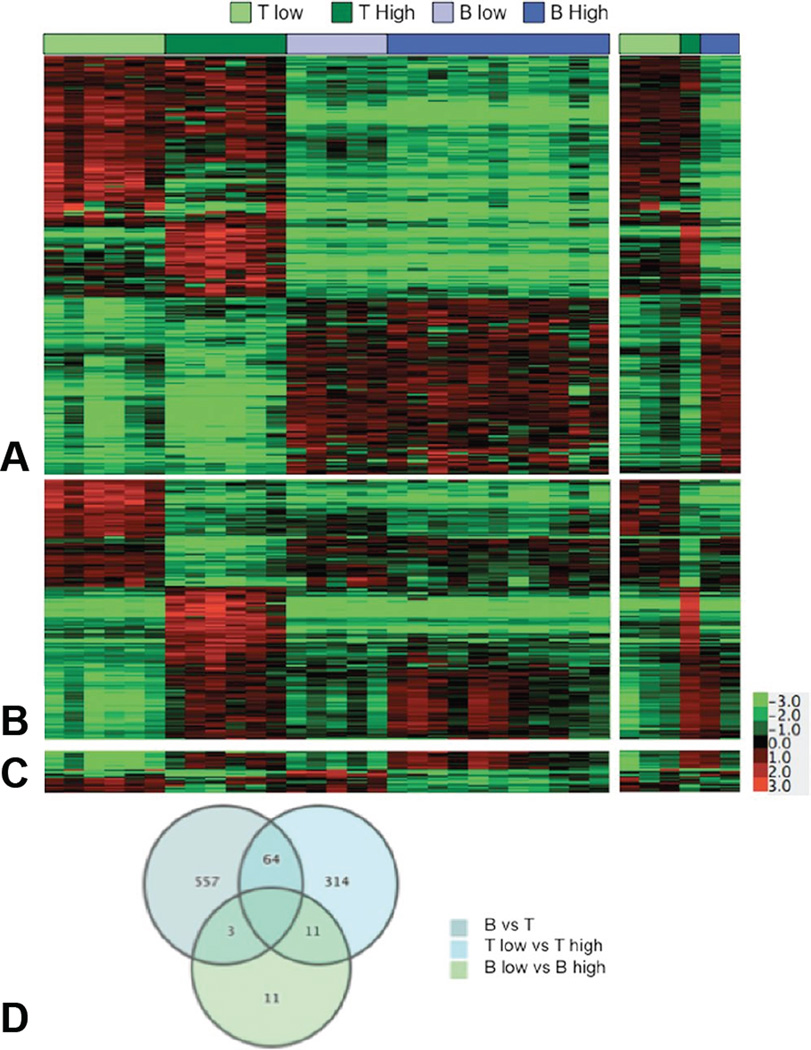
Figure 4.
Statistically significant genes define molecular subtypes of canine lymphoma. Genes differentially expressed with >3-fold average change and P values <0.001 were identified for the comparison of groups composed of (A) B-cell and T-cell lymphomas (n = 624), (B) high-grade and low-grade T-cell lymphomas (n = 389), and (C) high-grade and low-grade B-cell lymphomas (n = 25) using t test statistics. The second panel of (A–C) is an independent “validation” set (6 samples, right inset) of the results obtained in the initial set (29 samples, left panel). (D) Venn diagram showing the number of unique and overlapping genes for each 2-group test. Reproduced with permission from (Frantz et al., 2012).

