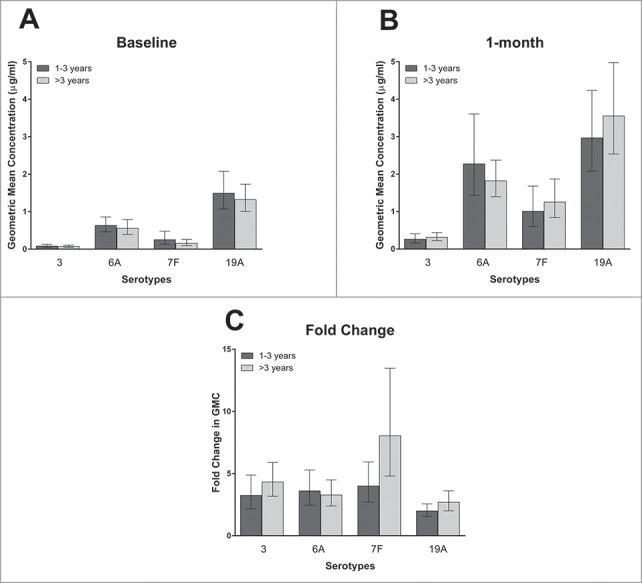
Figure 2.

The geometric mean of the antibody concentrations at baseline (2A) and 1 month post –vaccination (2B), and the geometric mean of the fold-change in antibody concentrations (2C), according to time since PPV receipt by serotype. Bars represent 95% confidence intervals. There were 42 and 54 subjects in the 1–3 and >3 y since PPV receipt groups respectively. Of note, serotype 6A is included in PCV-13 but not PPV, but serotypes 3, 7F, and 19A are included in both PCV-13 and PPV.
