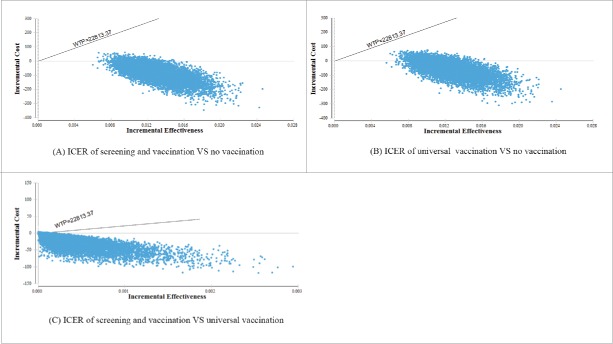
Figure 1.
Results of probabilistic sensitivity analysis The x-coordinate corresponds to the incremental QALYs gained, while the y-coordinate corresponds to the incremental cost saved ($); WTP=3 times China's per capital gross domestic product ($) /QALYsAbbreviations: ICER: incremental cost-effectiveness ratio; QALYs: quality-adjusted life years.

