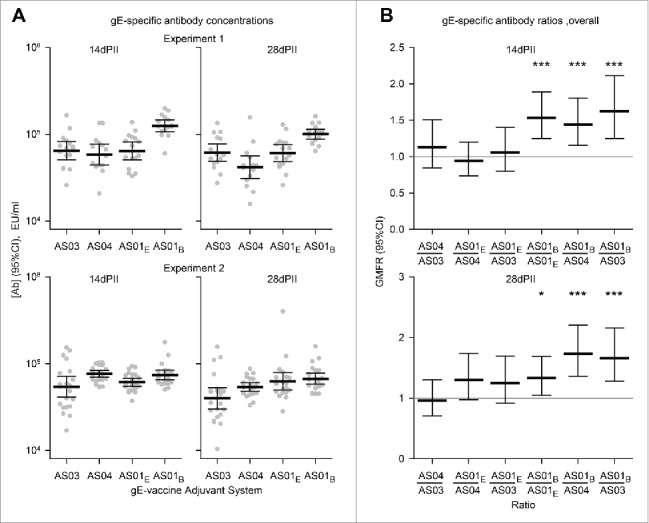
Figure 2.

Geometric mean concentrations (GMCs) of (A) gE-specific antibodies and (B) ratios of GMCs (GMFRs) from different adjuvanted-vaccine groups. Sera (Experiment 1, N = 16 1 and Experiment 2, N = 22) were sampled at 14 and 28 d after the second vaccine dose (14dPII and 28dPII, respectively). Error bars represent 95% confidence intervals. Antigen-specific antibodies were not detected in the NaCl group (concentrations were below the cut-off of the assay; i.e.<500 EU/ml). In (B), horizontal gray reference lines indicate a ratio = 1, and asterisks indicate significant differences from 1 (*p<0.05; *** p<0.001). Antigen-specific antibody concentrations (in EU/ml and defined by internal standards) were measured by ELISA as previously described.13 Statistical calculations were performed as described in Figure 1.
