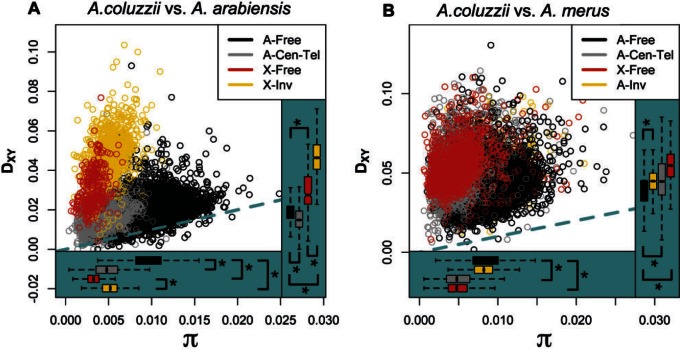
Fig. 4.—
Patterns of genetic divergence (Dxy) between populations as a function of nucleotide diversity (π) reveal differential gene flow during speciation. Genomic regions defined by expected rates of recombination in hybrids (see Methods) differ in their distributions of nucleotide diversity and genetic divergence, but not always in the same direction, suggesting that gene flow has been restricted on the X and lowly recombining regions in some cases. (A) Anopheles coluzzii versus Anopheles arabiensis; (B) A. coluzzii versus Anopheles merus. Panel legends indicate colors corresponding to genomic location of each 10 kb window where “Free” indicates freely recombining regions, “Cen-Tel” indicates centromeric and telomeric autosomal regions, and “Inv” indicates chromosomal inversions. “A-” and “X-” indicate autosome or X chromosome. Dashed blue-green line indicates perfect correlation. Asterisks indicate M–W tests with P < 3.92 × 10⁻⁵ for comparisons indicated with brackets. Note that the y-axis scale differs among panels.

