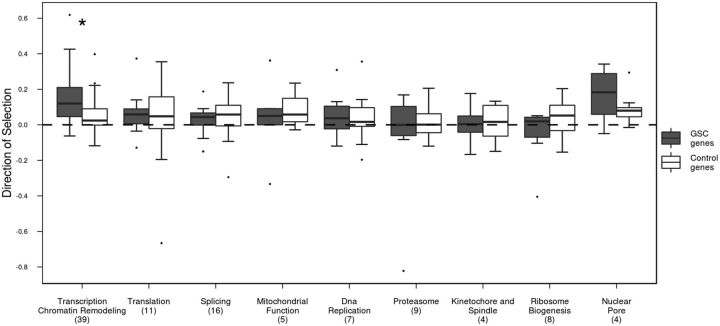
Fig. 1.—
DoS values of various molecular functions within the germline stem cell genes (dark gray) and its control genes (white). Significant difference (P value < 0.05) between stem cell group and its control genes is indicated with a star, whereas numbers in parentheses represent the number of genes examined for each stem cell group.

