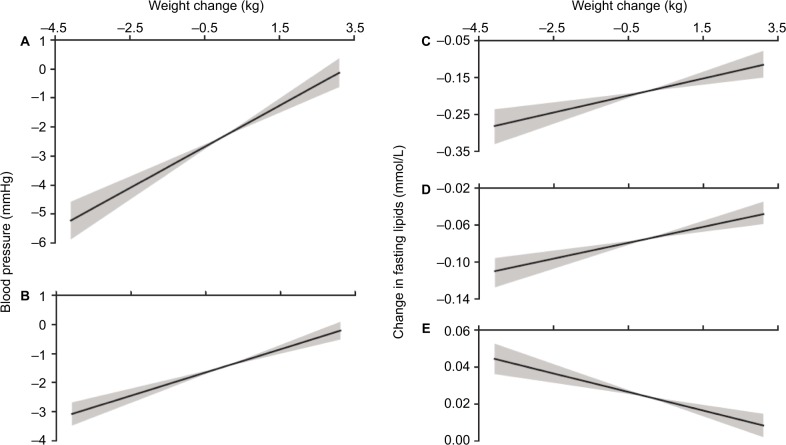
Figure 1.
Change in systolic (A) and diastolic (B) blood pressure (mmHg), change in triglycerides (C), VLDL (D), and HDL (E) (mmol/L) as a function of change in body weight (kg).
Notes: Solid lines are the best fit regressions from all 2,108 data points and the shaded areas represent the minimum and maximum slopes calculated from the ±95% confidence limits of the slopes. The X-axis limits are set to two standard deviations around the mean change in weight.
Abbreviations: HDL, high density lipoprotein; VLDL, very low density lipoprotein.

