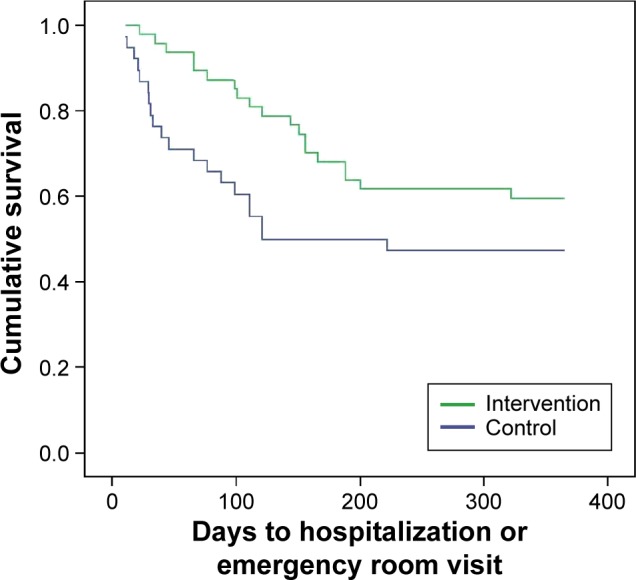
Figure 2.

Kaplan–Meier curve.
Notes: Probability of being treated for the first time in hospital during the 12 months of follow-up. (P=0.097).

Kaplan–Meier curve.
Notes: Probability of being treated for the first time in hospital during the 12 months of follow-up. (P=0.097).