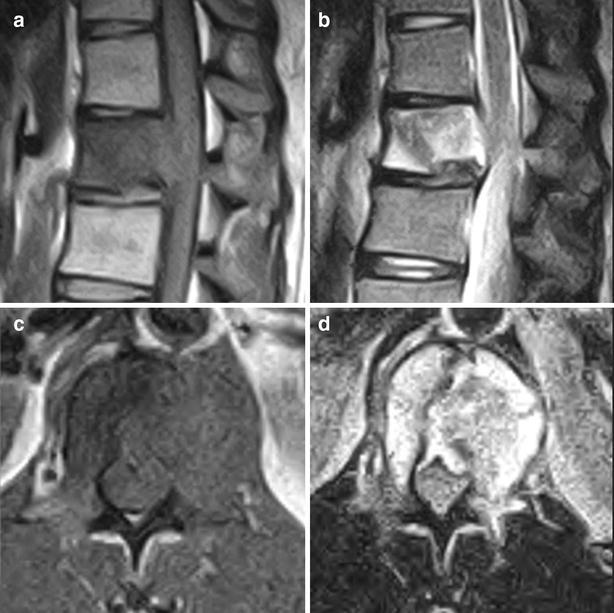
Fig. 2.

Sagittal magnetic resonance images showing low signal intensity changes of the L1 vertebral body on T1-weighted images (a) and high signal intensity changes on T2-weighted images (b). Axial magnetic resonance images showing low signal intensity changes of the L1 vertebral body and pedicle on T1-weighted images (c) and high signal intensity changes on T2-weighted images (d)
