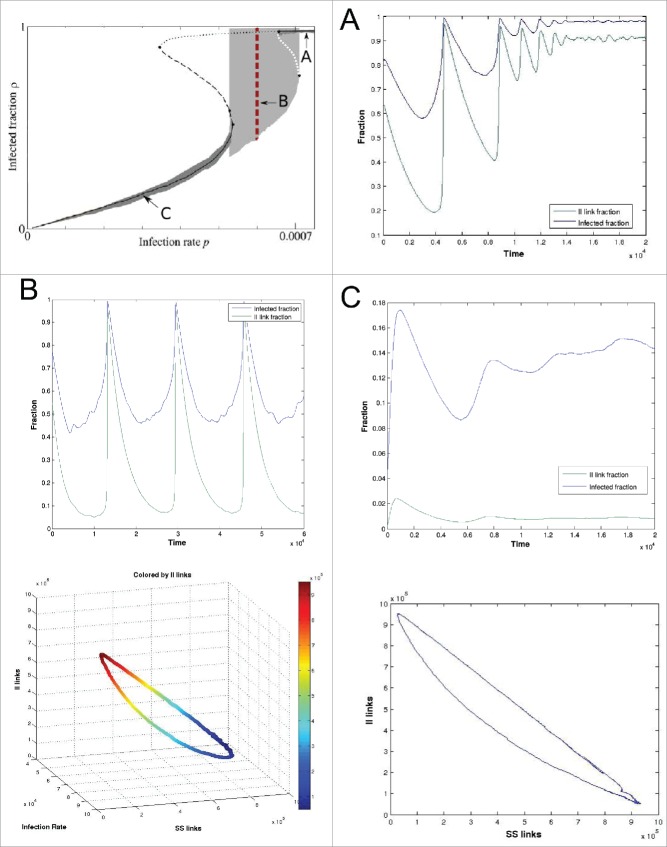
Figure 1.
(Top left) Model bifurcation diagrams wrt. the infection rate parameter p (reprinted with permission).16 (A) The system evolves to a stable stationary state for p = 0.00073. (B) Oscillatory behavior indicating a (coarse) limit cycle at p = 0.0006. (C) Stable stationary state for p = 0.0003. Bottom graphs indicate the relationship between i, lSS, and lII over the course of one complete oscillation for p = 0.0006. Model parameters: (r, w0, N, L) = (0.0002, 0.03, 105, 106).

