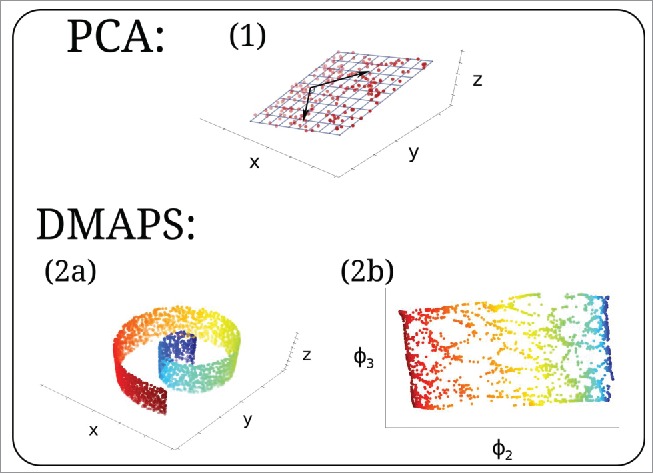
Figure 3.

(1) PCA uncovers the linear relationship (2-dimensional blue grid spanned by 2 black arrows) within a noisy data set of 3-dimensional points lying approximately on a plane (red dots). (2a) Three-dimensional data on a nonlinear, curved surface. Color denotes arclength. (2b) DMAPS embedding uncovering a 2-dimensional parameterization of the dataset. Color denotes arclength from (2a).
