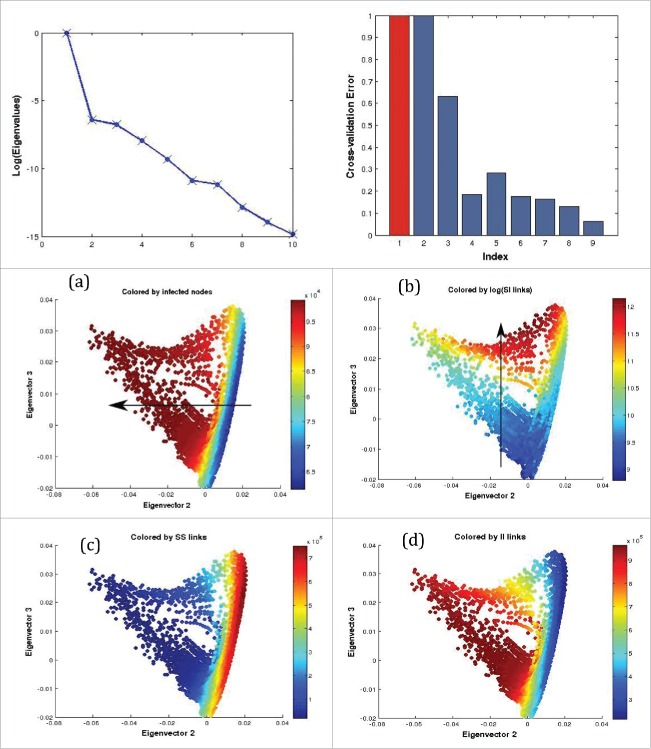
Figure 7.
Coarse variable detection: Top Left: The leading eigenvalues of the random walk matrix are plotted. Top Right: Computational criterion suggesting that the first 2 nontrivial eigendirections suffice (the one in red is the trivial one, and the fourth is much less important than the second and third). The x and y coordinates of the middle and bottom row figures indicate the components of each datum, representing a graph, in the second and third eigenvectors of the random walk matrix. Each point is also colored by the number of (a) infected nodes i, (b) log(SI-links), (c) SS-links, and (d) II-links found in the corresponding graph. A comparison between (a) and (b) suggests linear independence between i and log(lSI). An ϵ of 70 was used.

