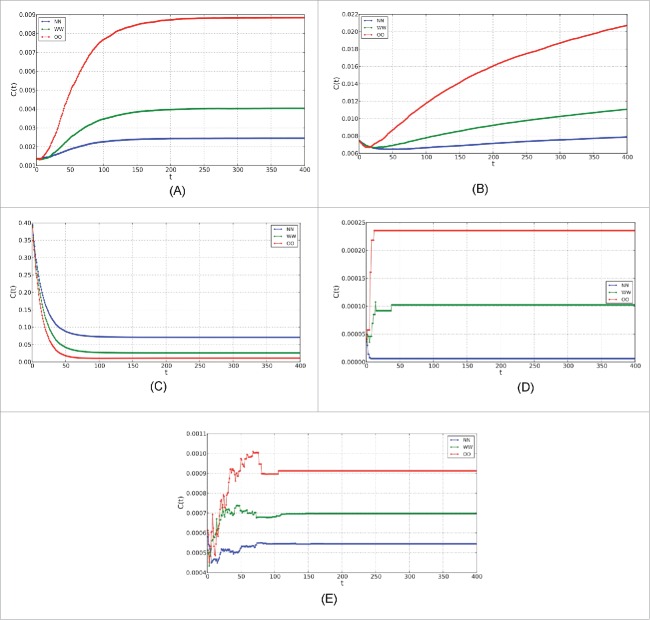
Figure 4.
Evolution of the mean clustering coefficient for each state and for the architectures and initial distribution of states (normal in blue, overweight in green and obese in red) of Section 2, with tolerance equal to 0.25 and connection probability of the Version 3. (A) Radom; (B) scale-free; (C) small-world; (D) empirical-1; (E) empirical-2.

