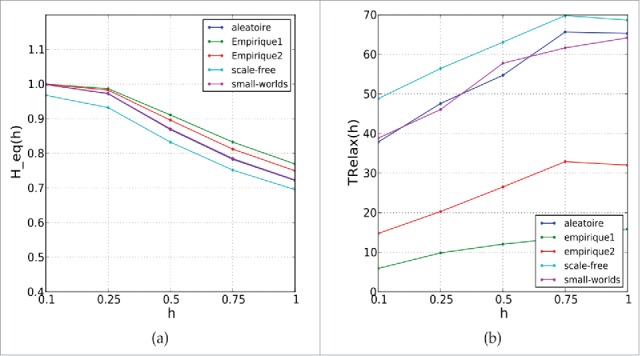
Figure 6.

Left: with connection probability of the Version 3, evolution of the homophily coefficient at equilibrium as function of the mean tolerance. Right: Evolution of the relaxation time to equilibrium as function of the mean tolerance. (A) Connection version 3; (B) connection version 3.
