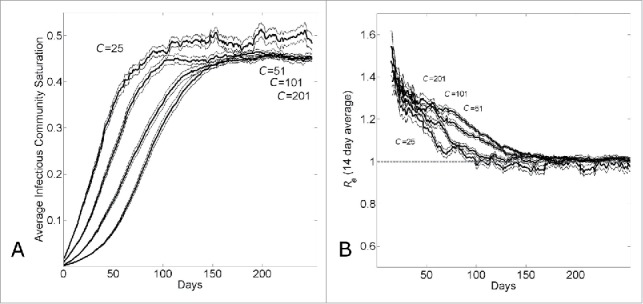
Figure 2.

The transition from exponential to linear growth in a population with household-community structure is due to local saturation of communities. (A) Average saturation of the communities of infected individuals and (B) 14-day running effective reproductive number Re14 vs. simulation day for different community sizes (C={25, 51, 101, 201}). Each curve shows the average and standard error of the results of 100 simulations seeded with one infectious individuals on the 1st day.
