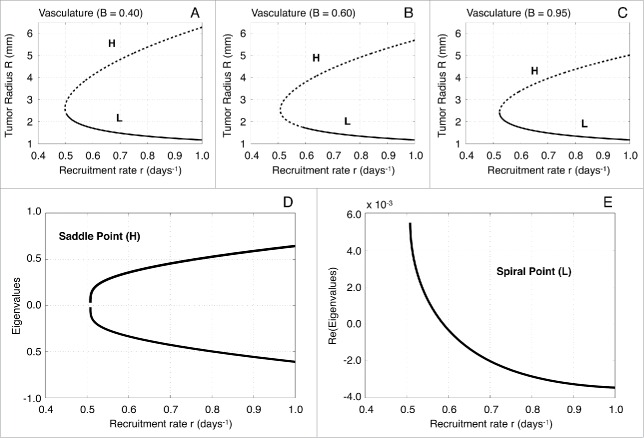
Figure 2.
Bifurcation diagrams with respect to the immune recruitment rate r and local stability analysis. (A–C) One-parameter bifurcation diagrams with respect to the effector cell recruitment rate r for different values of the functional tumor-associated vasculature (0.40, 0.60 and 0.95, respectively). The upper branches correspond to the saddle point H, whereas the lower branches to the spiral point L. Solid lines depict stable fixed points and dotted lines the unstable fixed points. (D) Eigenvalues of the Jacobian estimated at the saddle point H with respect to the parameter r for vascularization B = 0.60. (E) Real part of the eigenvalues of the Jacobian estimated at the spiral point L with respect to the parameter r for vascularization B = 0.60.

