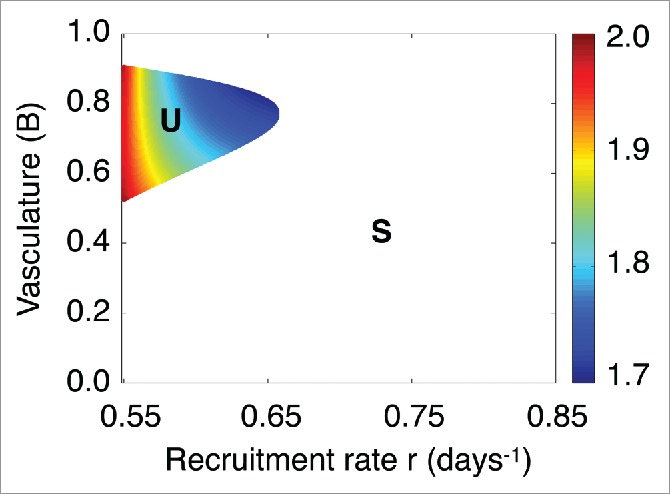
Figure 6.

Dependence of the zero-rate energy function effect on the functional tumor-associated vasculature B and immune recruitment rate r. Dependence of the effect of on the model parameters r and B in the unstable regime of denoted by U. The label (S)stands for the regime where the spiral point is stable and tumor control is reached.
