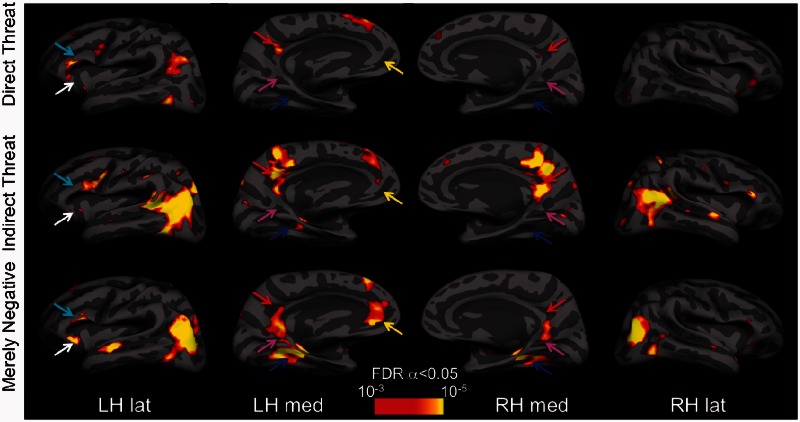
Fig. 2.
Statistical parametric maps for the Direct Threat, Indirect Threat and Merely Negative conditions shown on the inflated group average brain. The BOLD activations evoked by the Direct Threat > Neutral images contrast (top row), Indirect Threat > Neutral images contrast (middle row) and Merely Negative > Neutral images contrast (bottom row). The maps were obtained by computing group (N = 20) contrasts in SPM8, aligning them with, and overlaying them on, the group average brain surface made with Freesurfer. All SPMs are corrected for multiple comparisons with the FDR α = 0.05 (which varies contrast to contrast), but displayed at the same, more stringent threshold. The arrows indicate some of the ROIs with notable activation differences for the different scene categories: PHC (blue), RSC (magenta), PCC (red), OFC/vmPFC (white), vlPFC (cyan). images in the different categories did not differ in their spatial frequency content (Supplementary Figure S1).

