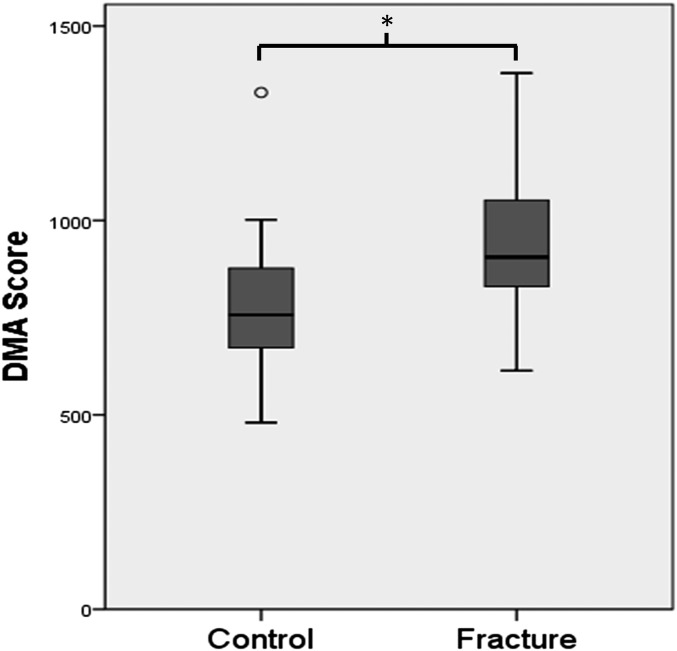
Fig. 3.
Comparison of the DMA scores as a measure of postural stability between study groups. The control group had a score of 790 points and the fracture group had a score of 933 points, and this difference was significant at p = 0.008 (indicated by the asterisk). The box-and-whisker plots represent the total range, the interquartile range, and the median. The circle indicates an outlier (a value >1.5 times the interquartile range from the top whisker).

