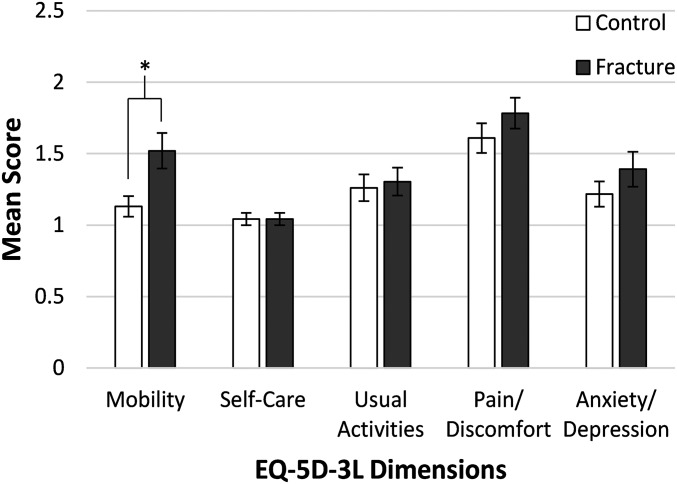
Fig. 4.
Comparison of the EQ-5D-3L subscores, which are scored between 1 and 3 and in which a higher score indicates worse function, between the study groups. Patients in the fracture group had worse self-rated mobility scores than the control cohort, and this difference was significant at p = 0.03 (indicated by the asterisk). Values are plotted as the median and standard deviation.

