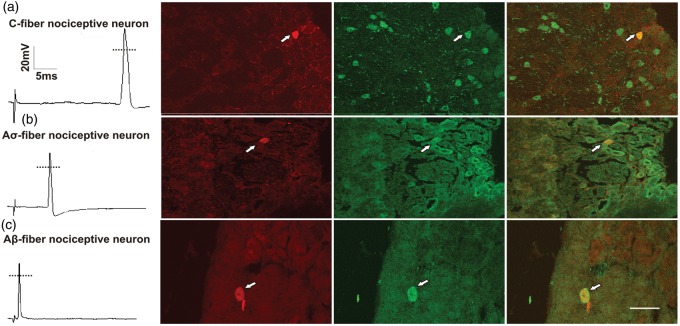
Figure 3.
DRG classification and substance P colocalization.
Examples of an evoked AP for each nociceptive neuron type (first column) and micrographs showing representative neurobiotin labelled DRG neurons in sections colabelled for SP. Each micrograph row consists of three images: left panel illustrates cells filled with neurobiotin in red (Texas Red); middle panel illustrates cells immunoreactive to SP in green (AlexaFluor 488); and right panel displays the merged images to show signal colocalization (yellow). Dye-labelled cells are indicated by arrowheads. Scale bar represents 50 µm. DRG: dorsal root ganglia; AP: action potential; SP: substance P.

