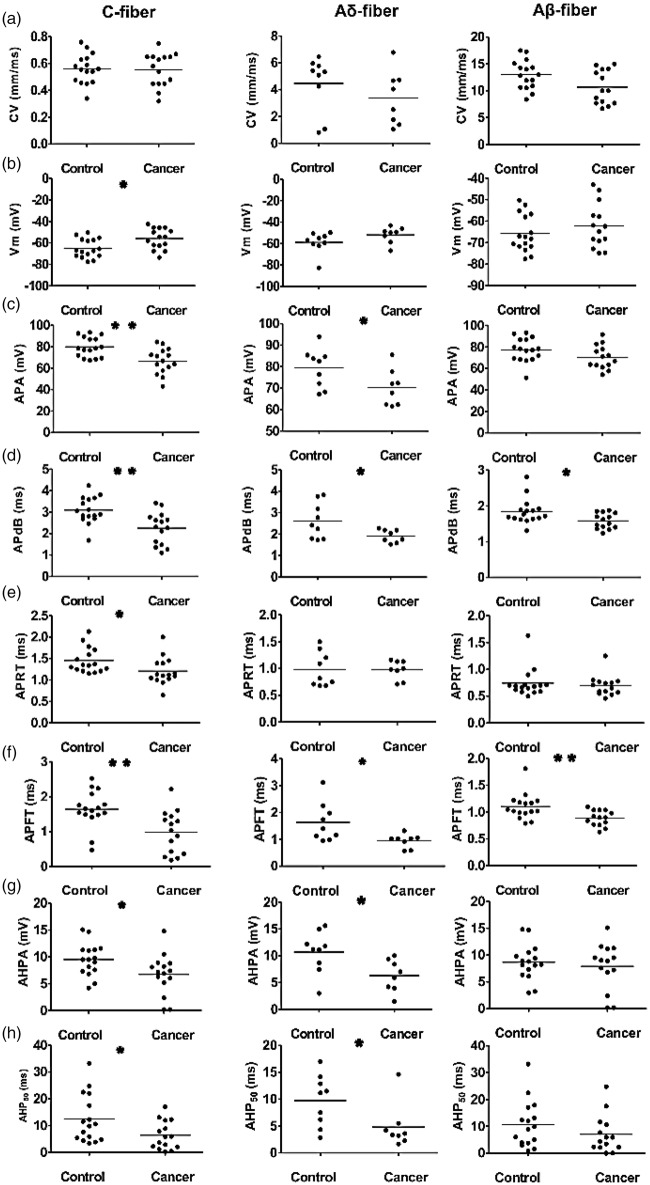
Figure 4.
Action potential properties of DRG neurons in control and cancer rats. Scatter plots of properties of evoked APs in individual neurons. The median is superimposed as a horizontal line. Each column represents a specific neuron type: C-fibre nociceptive neurons (a), Aδ-fibre nociceptive neurons (b), and Aβ-fibre nociceptive neurons (c). The recorded variable panels are in rows, as follows: (a) CV; (b) resting membrane potential (Vm); (c) APA; (d) APdB; (e) APRT; (f) APFT; (g) AHPA; and (h) after hyperpolarization duration to 50% recovery (AHP50). Asterisks indicate differences between control and cancer rats: *p < 0.05, **p < 0.01. DRG: dorsal root ganglia; AP: action potential; APA: action potential amplitude; APdB: action potential duration at base; APRT: action potential rise time; APFT: action potential fall time; AHPA: after hyperpolarization amplitude below Vm; AHP50: after hyperpolarization duration to 50% recovery; CV = conduction velocity.

