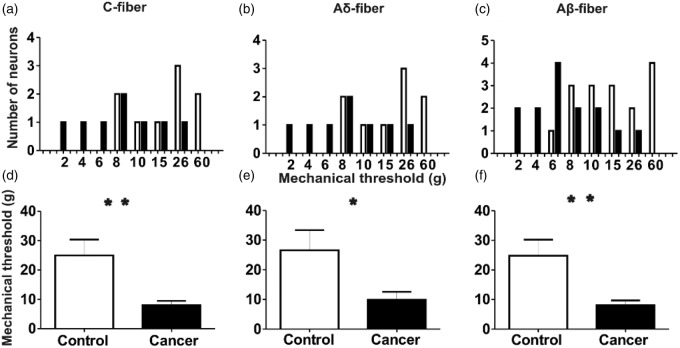
Figure 5.
Comparison of the mechanical response threshold of DRG nociceptive neurons to application of von Frey filaments to the peripheral receptive fields of control and cancer rats.
The upper row shows the distribution of the mechanical activation thresholds of the individual neurons. Columns indicate distribution of the number of neurons activated by each mechanical stimulus (in grams) in C- (a), Aδ- (b) and Aβ-fibre (c) neurons in the cancer animals (filled bars) compared with the control animals (open bars). The lower row shows the mean mechanical response thresholds of neurons of each classification in control and cancer rats. *p < 0.05, **p < 0.01. DRG: dorsal root ganglia.

