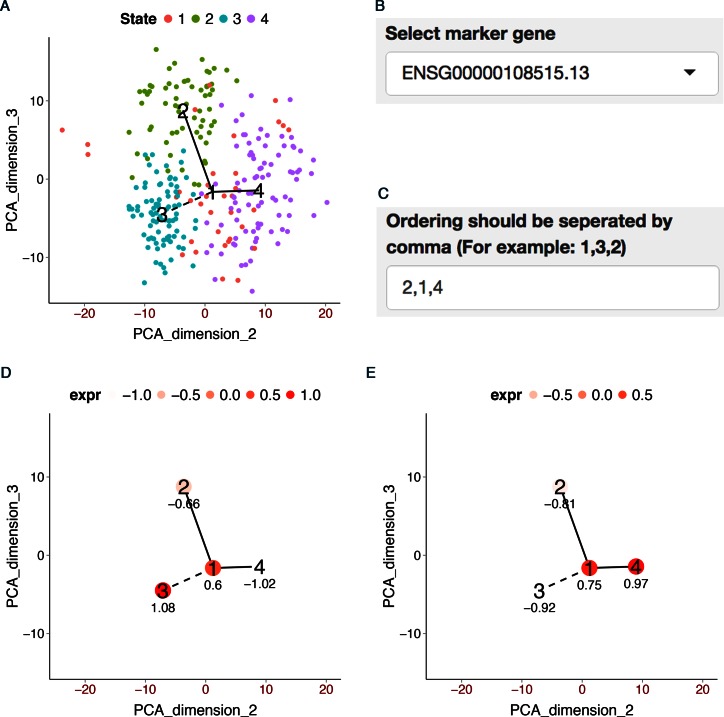
Figure 5.
Demonstration of GUI and TSCAN analysis of HSMM data using all genes for pseudo-time reconstruction. (A) MST constructed by TSCAN using all genes. (B) Users can choose a marker gene in GUI to visualize its expression. (C) Users can define a path by specifying the clusters to include and their ordering. (D) The average expression of SPHK1 in each cluster. (E) The average expression of ENO3 in each cluster.

