Figure 3.
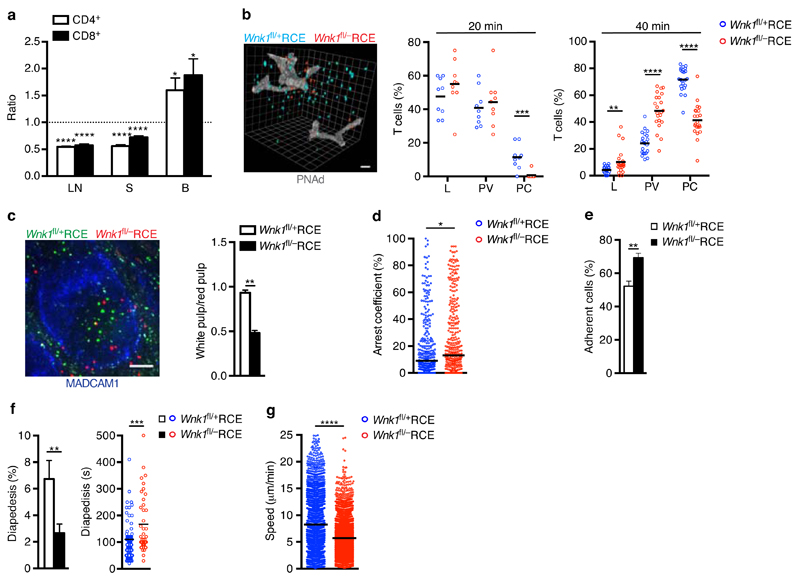
WNK1 is required for efficient homing into lymph nodes. (a) Ratio of WNK1-deficient to control mouse T cells in lymph node (LN), spleen (S) and blood (B) 1 h after i.v. injection into C57BL/6J recipients normalized to input ratio. (b) Percentage of T cells located in the lumen (L), perivascular area (PV) or parenchyma (PC) of LN as determined by 3D-histology 20 and 40 min after transfer; image shows location of T cells (blue and red) and HEVs revealed by expression of PNAd (white) 40 min after transfer; scale bar 20 μm. (c) Ratio of CD4+ T cells in the white to red pulp of the spleen 1 h after T cell transfer. Image shows T cells (red and green) in the spleen, MADCAM1 (blue) indicates boundary between red and white pulp; scale bar 100 μm. (d) Percentage of time control and WNK1-deficient T cells arrested (<2 µm/min) while migrating over an endothelial cell monolayer under flow conditions. (e) Percentage of cells that remained adherent on endothelial cells 10 min after arrest. (f) Percentage of cells that underwent diapedesis through endothelial cell monolayer and duration of diapedesis. (g) Speed of cell migration on the endothelial cell monolayer. *P < 0.05, **P < 0.01, ***P < 0.001, ****P < 0.0001 (1-sample t-test (a), Mann-Whitney (b,c,d,e,g, and f, time of diapedesis), Wilcoxon matched-pairs test (f, % diapedesis). Sample sizes: a (12, lymph node and spleen; 11, blood), b (9, 20 min; 22, 40 min), c (6), d (343, control; 364, mutant), e (9), f (8, % diapedesis; 73 control and 40 mutant, time of diapedesis), g (2508, control; 3846, mutant). Data are from one experiment representative of 2 experiments (d), or pooled from 2 independent experiments (a,b,c,e,f,g). Graphs show mean±SEM except d where horizontal lines indicate median.

