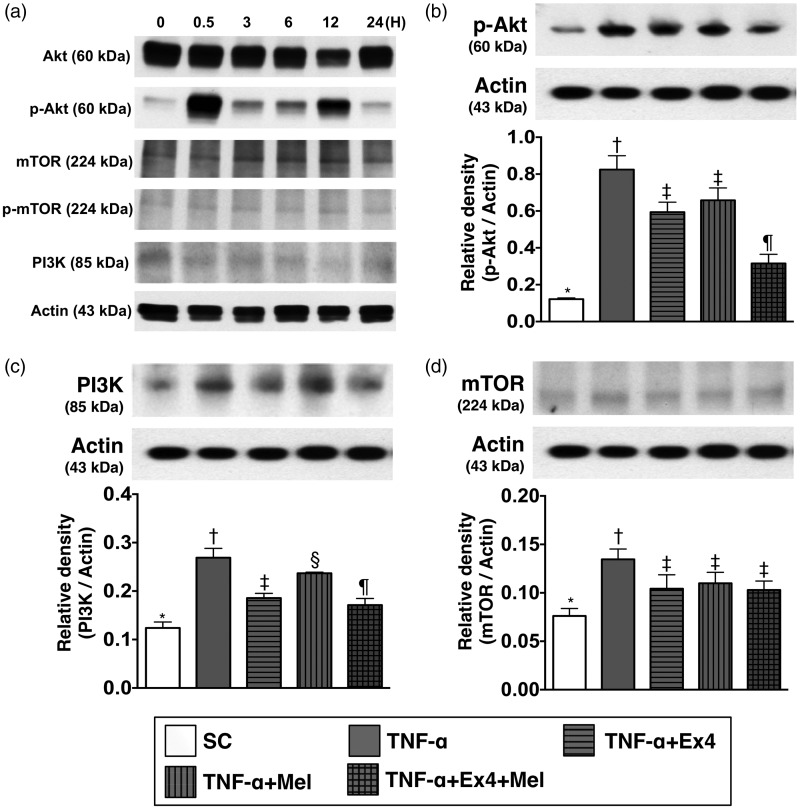
Figure 1.
Time courses of PI3K/AKT/mTOR expressions with respect to TNF-α stimulation and the impact of Ex4–Mel treatment on regulating PI3K/AKT/mTOR signaling pathway. (a) The protein expression of p-AKT and PI3K were unregulated at the time intervals of 30 m, 3, 12, and 24 h, whereas the protein expression of mTOR at these time intervals was not obviously changed. Two peak levels of p-AKT protein were identified at 30 min and 12 h with respect to TNF-α stimulation. (b) The protein expression of p-AKT, control vs. TNF-α treated group, p < 0.001; * vs. other groups with different symbols (†, ‡, §), p < 0.001. (c) The protein expression of PI3K, control vs. TNF-α treated group, p < 0.008; * vs. other groups with different symbols (†, ‡, §, ¶), p < 0.008. (d) The protein expression of mTOR, control vs. TNF-α treated group, p < 0.01; * vs. other groups with different symbols (†, ‡), p < 0.01. All statistical analyses were performed by one-way ANOVA, followed by Bonferroni multiple comparison post hoc test (n=4 for each group). Symbols (*, †, ‡, §, ¶) indicate significance (at 0.05 level). Ex4: exendin-4; Mel: melatonin; TNF: tumor necrosis factor

