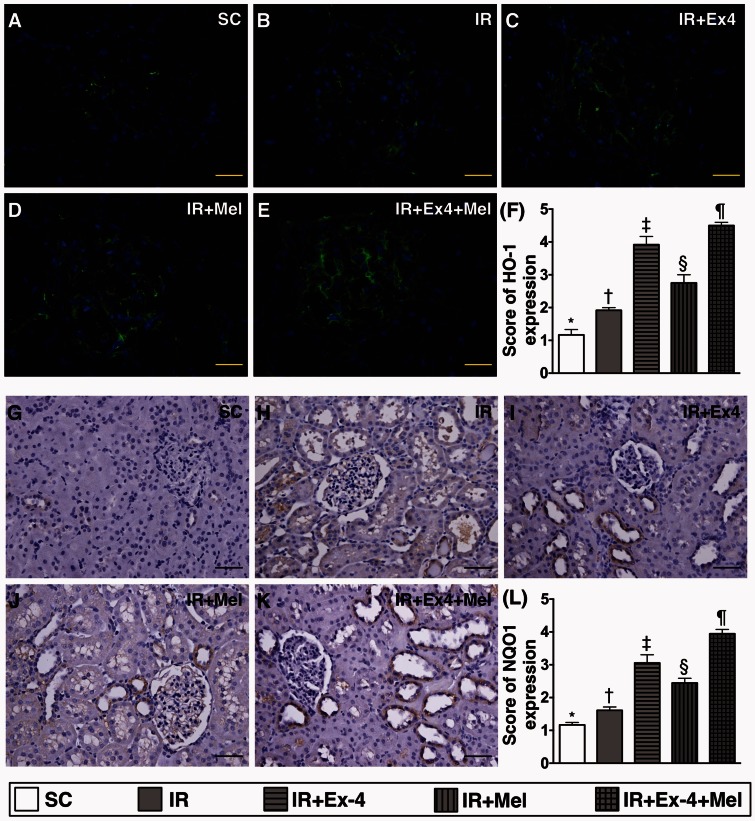
Figure 10.
Immunohistochemical (IHC) and immunofluorescent (IF) staining for identification of antioxidants in kidney parenchyma at 72 h after IR procedure. (a) to (e) illustration of microscopic finding (400×) of IF stain for identifying the heme oxygenase (HO)-1-positively stained cells (green color) in renal tubules. Scale bars in right lower corner represent 20 µm. (f) Analytic results of HO-1+ cell expression, SC vs. IR, p < 0.0001; * vs. other groups with different symbols (†, ‡, §, ¶), p < 0.0001. (g) to (k) Illustration of microscopic finding (200×) of IHC stain for identification of NAD(P)H dehydrogenase (quinone) 1 (NQO 1) (gray color) in renal parenchyma. (l) Analytical results of NQO 1+ cell expression, SC vs. IR, p < 0.0001; * vs. other groups with different symbols (†, ‡, §, ¶), p < 0.0001. Scale bars in right lower corner represent 50 µm. All statistical analyses were performed by one-way ANOVA, followed by Bonferroni multiple comparison post hoc test (n=8 for each group). Symbols (*, †, ‡, §, ¶) indicate significance (at 0.05 level). Ex4: exendin-4; IR: ischemia–reperfusion; Mel: melatonin; SC: sham control. (A color version of this figure is available in the online journal.)

