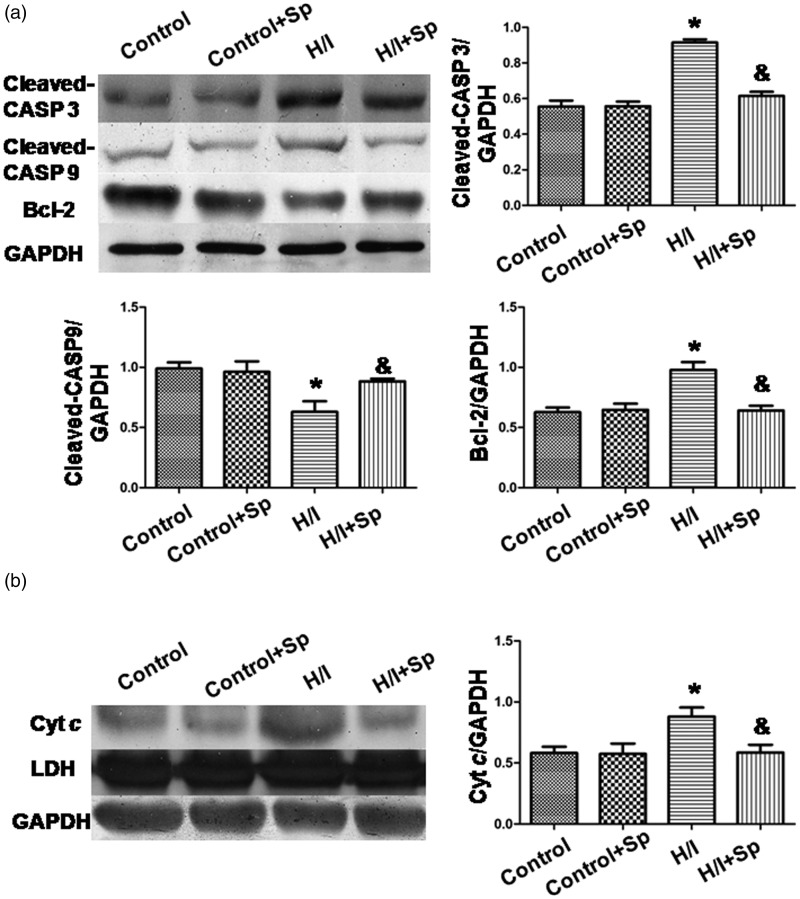
Figure 5.
Protein expression of cleaved caspase-3 and-9, Bcl-2, and cytosolic cytochrome c. (a) Cleaved caspase-3 and -9 and Bcl-2 expression. (b) Cytochrome c release. The intensity of each band was quantified by densitometry, and the data were normalized to GAPDH. Lactate dehydrogenase (LDH) served as a cytosolic marker. All the data were from n = 4 independent experiments. *p < 0.05 versus control; &p < 0.05 versus H/I

