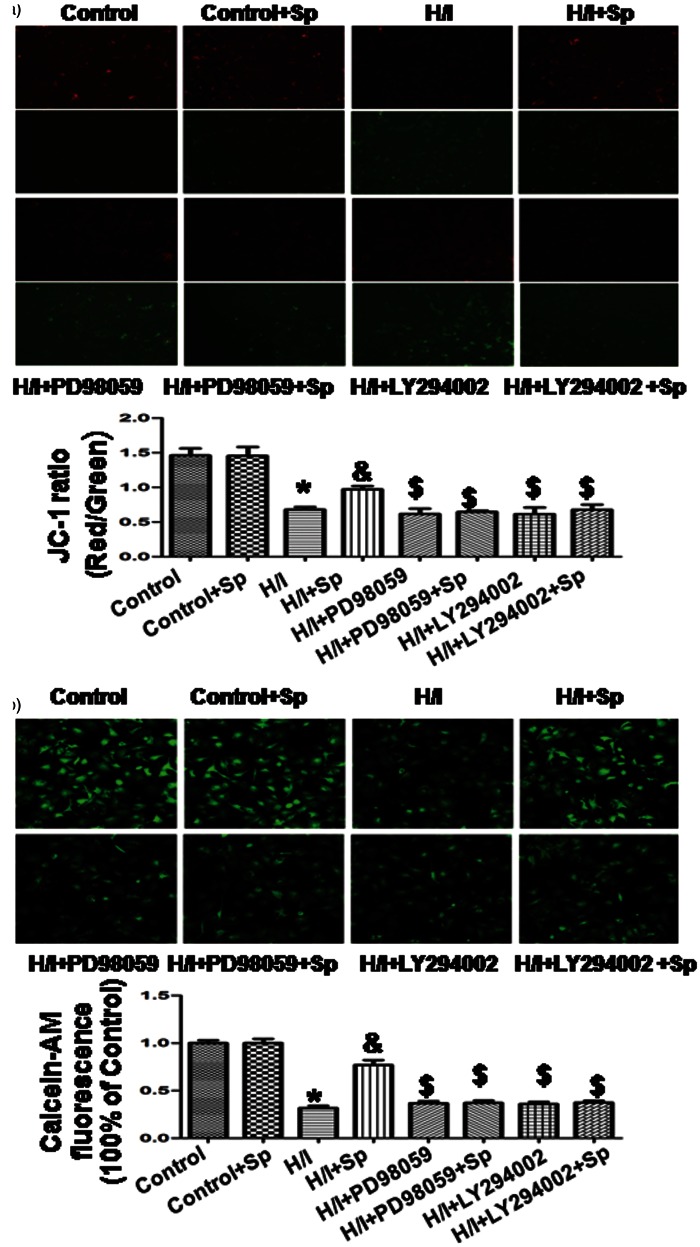
Figure 7.
Measurement of mitochondrial membrane potential (Δψm) and mitochondrial pore (mPTP) opening. (a) Δψm was measured by JC-1 imaging. Cells of different groups were stained using the JC-1 probe and the images were obtained by fluorescent microscopy. JC-1 spontaneously forms J-aggregate and exhibits red fluorescence under a high potential. The JC-1 monomeric form shows green fluorescence under a low potential. The individual red and green average fluorescence intensities are expressed as the ratio of red to green fluorescence. (b) Calcein AM was used to measure the changes of mPTP opening. The fluorescence intensity in the control group was considered to be 100% viable. The changes in fluorescence intensity are inversely proportional with the degree of mPTP opening. All the data were from four independent experiments. *p < 0.05 versus control; &p < 0.05 versus H/I; $ p < 0.05 versus H/I + Sp. (A color version of this figure is available in the online journal.)

