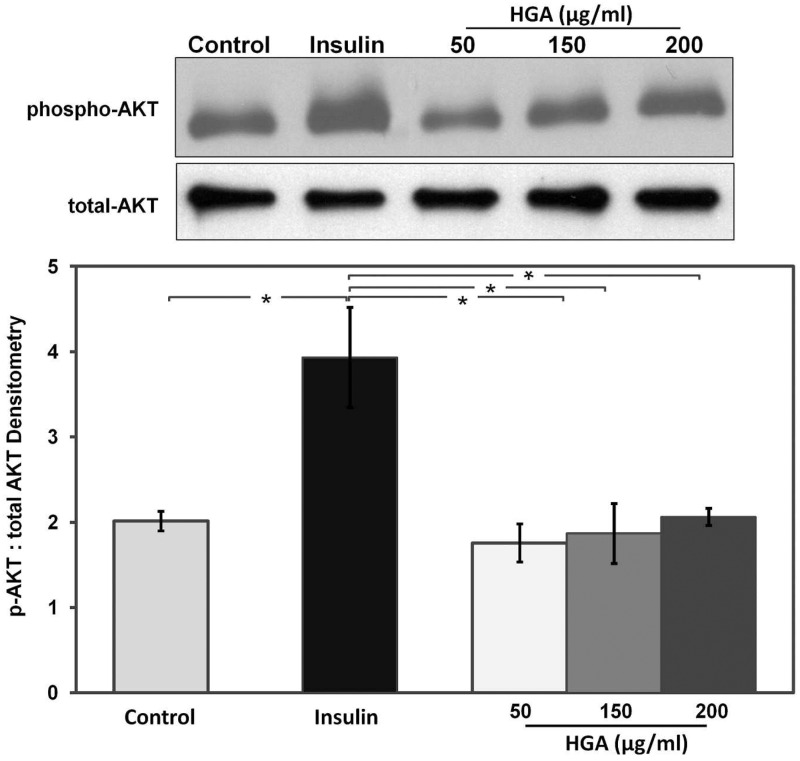
Figure 1.
(a) Western blot analysis of insulin and variable HGA treatment (50–200 µg/mL) on phosphorylated (phospho) and total AKT protein expression in KGN cells after 1 h incubation. Untreated control was used for estimation of basal levels. (b) Graph of the densitometric analysis of the effect of insulin and HGA on activation of AKT (phospho-AKT): total AKT in KGN cells. *P < 0.05. Data are representative of three independent experiments

