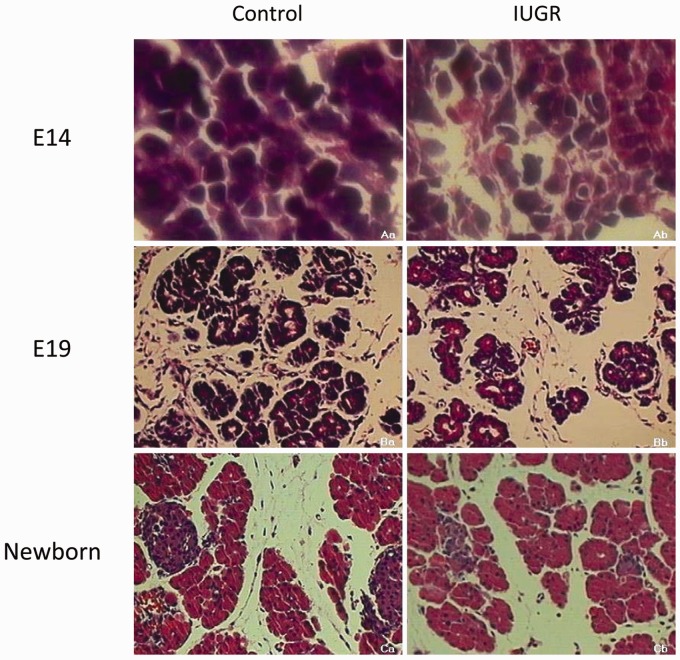
Figure 2.
Light microscope examination of pancreas tissues stained with HE for control (a) and IUGR (b) rats. The “a” represents the rats at embryonic day 14 (E14); “b” represents the rats at embryonic day 19 (E19); “c” represents the rats at embryonic day 21 (newborn). Image a: 1000× magnification; images b and c: 200× magnification. (A color version of this figure is available in the online journal.)

