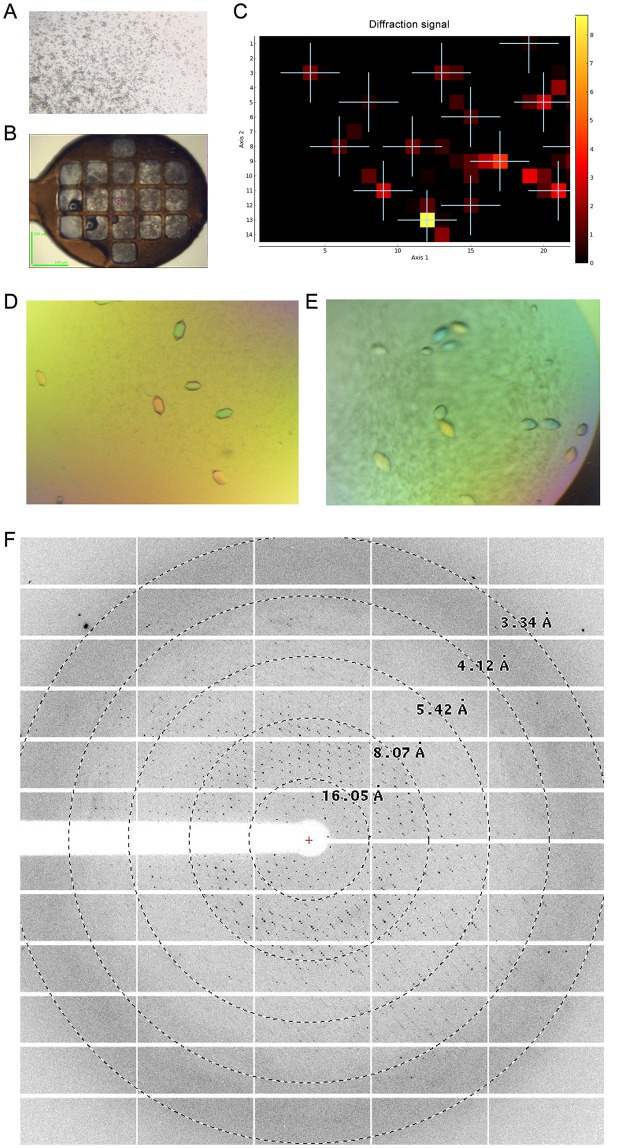
Fig 6. Crystallization of TYR469.
A. Picture of the initial crystallization hit of TYR469 in 100 mM (NH)4SO4, 10 mM MgCl2, 50 mM MES, pH 5.9, and 18% PEG8000 (w/v). B. Picture of a Cryoloop containing multiple microcrystals suitable for an X-ray mesh scan. C. Heat map resulting from the cryoloop mesh scan. The cross spots indicate diffracting crystals positions. The quality of the diffraction is scored based on a colour gradient (from yellow—poor—to dark red—highest–). D. Picture of TYR469 crystals with 0.5% polyvinylpyrrolidone K15 (w/v) as an additive (HR2-138 condition E2, Hampton Research). E. Picture of TYR469 crystals with 10 mM spermine tetrahydrochloride as an additive (HR2-138 condition D3). F. Representative X-ray diffraction pattern of a crystal from E. Resolution circles are indicated.

