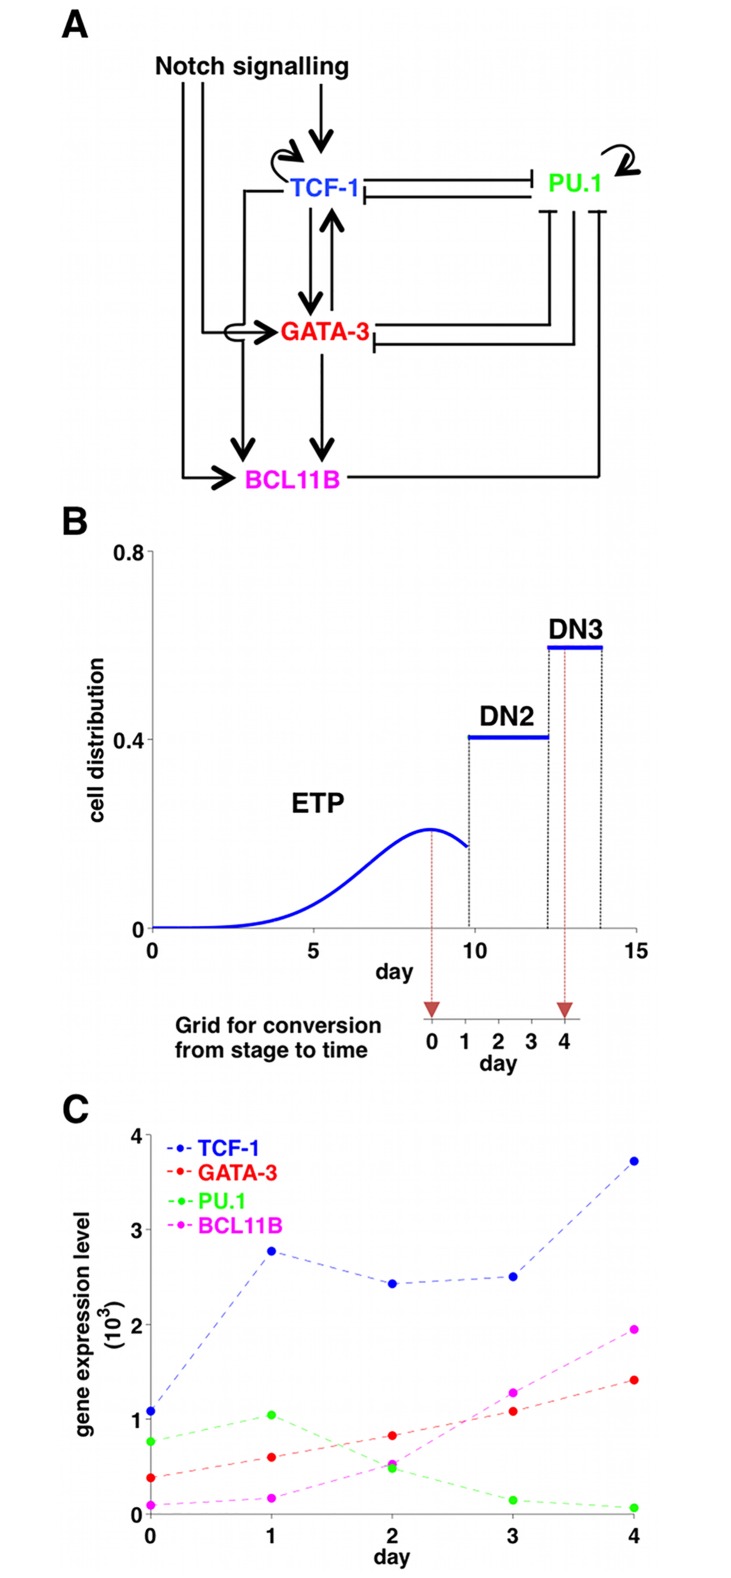
Fig 1. Core gene regulation in T-cell development.
(A) A minimal gene regulatory network for T-cell specification. (B) From stage series to time series. In vivo cell distributions at ETP, DN2, and DN3 stages (adapted from [45]). The mean transit time in the ETP stage is 10 days circa, but most of the ETP cells are produced at the end of the 10 days, after several cell divisions: that justifies the lag of only 1 day between ETP (day 0) and ETP-DN2a (day 1). The mean transit time between DN2a and DN3a is about 3 days, so we decided to separate ETP-DN2a, DN2a (day 2), DN2b (day 3), and DN3a (day 4) by lags of 1 day each. (C) Gene expression profiles of TCF-1 (blue), GATA-3 (red), BCL11B (magenta), and PU.1 (green) at the fundamental stages of T-cell specification (adapted from [17] according to our conversion stage to time). The dashed lines were added to underline the trends of the gene expression profiles. The errors, which are shown in Fig 3 for each gene separately, were estimated (CV percentages) from for each population from the log values of relative expression.

